2023年绿色出行出海趋势第4期:挪威新能源汽车行业概览
来源:岭南论坛 时间:2023-07-12

上一期我们提到,欧洲是目前全世界新能源汽车渗透率最高的市场,但欧洲各地区新能源发展情况呈现地域性差异,北欧市场相对更成熟、西欧次之、南欧最低,本期将对北欧市场中最有代表性的挪威新能源汽车行业具体展开分析。
挪威在全世界范围内一直是新能源汽车领域的先行者,其国民的高消费能力、环保理念盛行以及政府的强补贴等影响下,新能源汽车在挪威发展快速,在基础设施和市场方面有着成熟的体系。目前挪威新能源汽车市场保有量以纯新能源汽车为主,占比超7成,插电式混动汽车则显得力不从心,2022年挪威新注册插电式混动汽车同比下滑超57%。
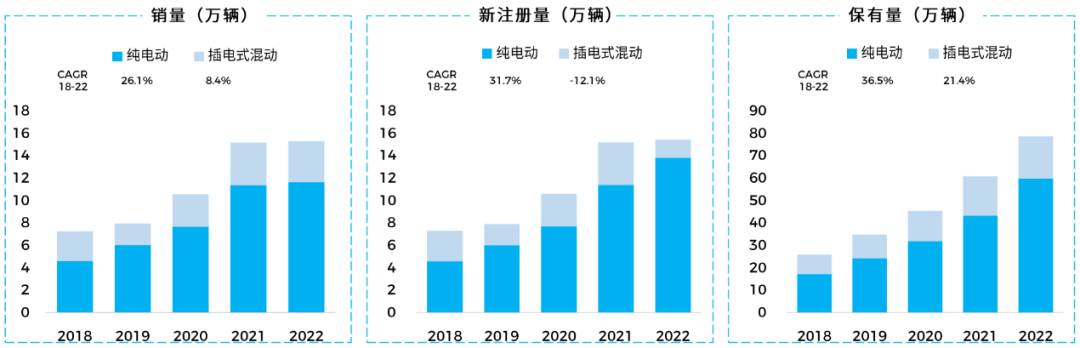
2018-2022挪威新能源汽车发展情况
(图来源:飞书点跃《2023年绿色出行出海趋势报告》,Statista,IEA,CleanTechnica,Meet Intelligence)
在挪威新能源汽车市场中,目前仍以美、德、日系车企为主。纯新能源汽车市场以美国特斯拉领先,插电式混动汽车则是瑞典佛尔沃、日本丰田表现抢眼。
近年来,中国新能源造车新势力如蔚来、小鹏等把挪威作为抢滩欧洲首个站点,但由于进入时间相对美、德、日系车企较晚,目前并未跻身头部行列。
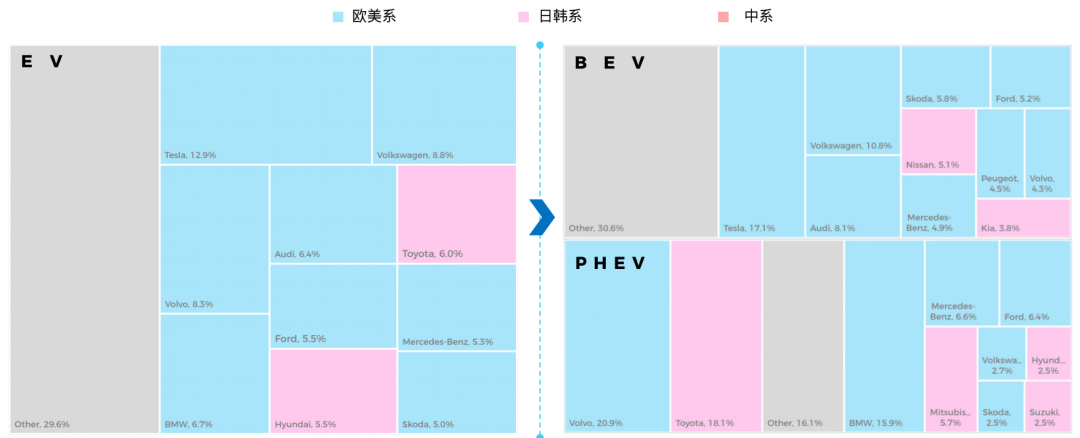
2021年挪威新能源汽车厂商格局(按销量)
(图来源:飞书点跃《2023年绿色出行出海趋势报告》,Statista, Meet Intelligence)
得益于较完善的充电设施布局密度,叠加高消费能力和政府极大的购车补贴力度,2022年挪威畅销车型全部为纯新能源汽车,中高端车款需求旺盛,相比其他欧洲国家,挪威的畅销车型多数售价超过4.7万欧元。
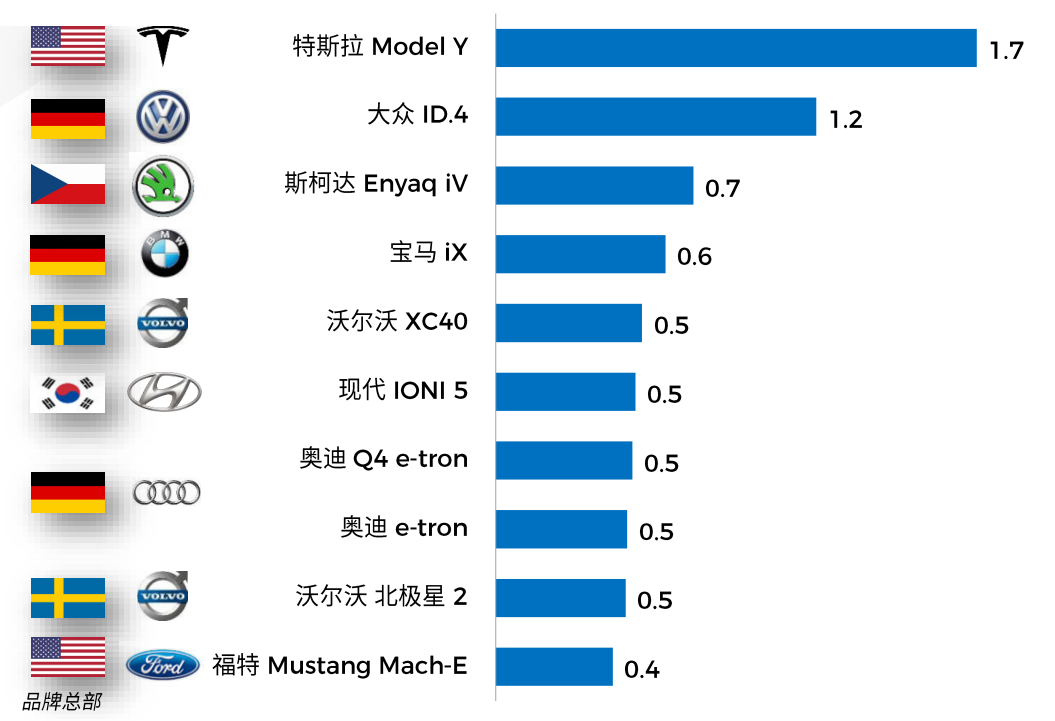
(图来源:飞书点跃《2023年绿色出行出海趋势报告》,Norsk Elbilforening, Meet Intelligence)
挪威拥有丰富的水电资源和热电资源,用电成本极低,非常适宜发展新能源汽车产业。相较于其他欧洲国家,挪威大多数家庭都有充电桩,且新能源汽车公共快速充电桩保有量处于领先水平,建设速度也一直处于高增长状态。高密度充电设施布局配置,是挪威新能源汽车产业快速发展的后盾。
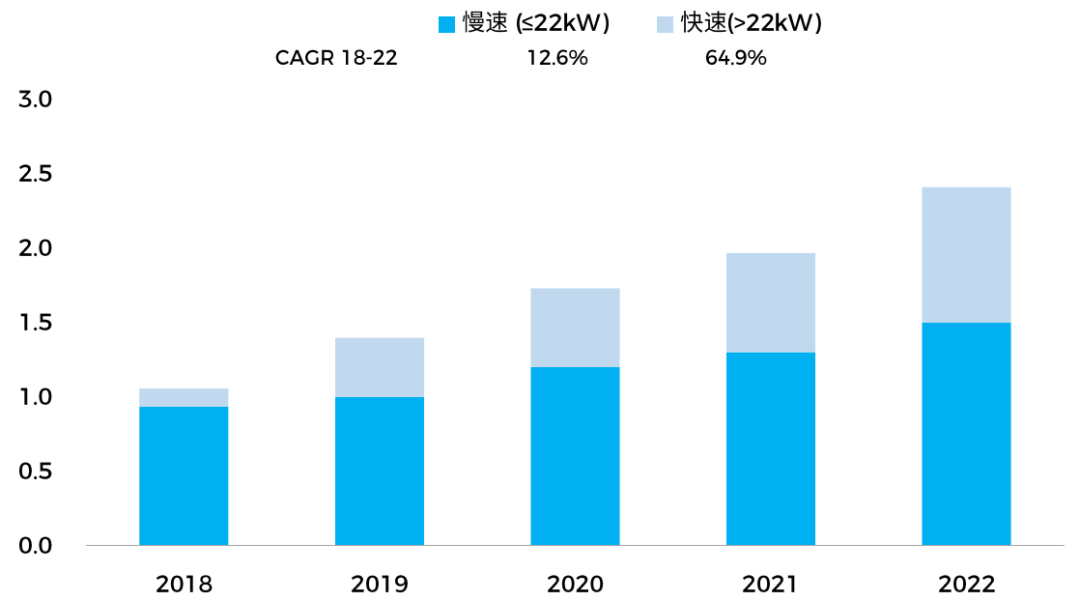
(图来源:飞书点跃《2023年绿色出行出海趋势报告》,IEA, Meet Intelligence)
挪威新能源汽车消费人群普遍享受生活,喜欢旅行、电影和音乐,高收入人群数量多,具有高消费能力。其中,年轻人群消费需求旺盛,品质车款和品质生活相结合的传播内容,使年轻人更热衷纯电动车消费。而城镇老年群体以阅读、园艺等慢生活节奏为主,影音娱乐、旅行、高生活品质的消费理念,使混动车在城镇老年群体市场中取得了较好的销量回馈。
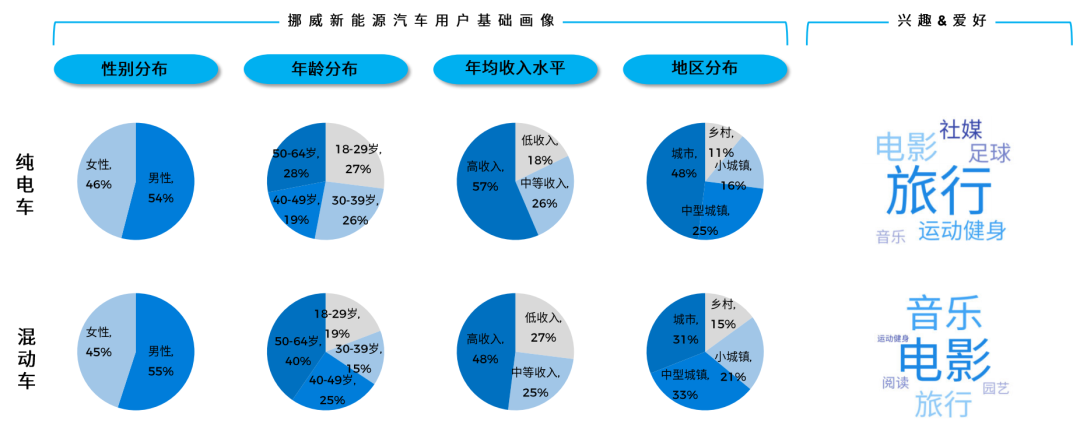
(图来源:飞书点跃《2023年绿色出行出海趋势报告》,Statista,Consumer Survey, Meet Intelligence)
由于挪威新能源汽车消费已深入人心,挪威的二手新能源汽车市场也同样繁荣。对于挪威消费者来说,经济适用是电动车购买主因,新技术、豪华品牌车款体验也是重要需求,因此期望以高性价比享受高配置和用车体验是他们换车的主要意愿。
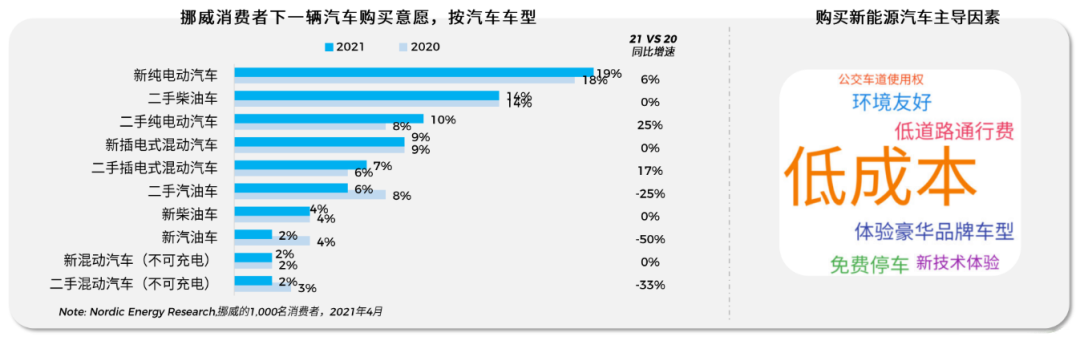
(图来源:飞书点跃《2023年绿色出行出海趋势报告》,Nordic Energy Research,Norsk Elbilforeningen, Meet Intelligence)
市场快速发展的同时,新能源汽车在挪威的发展仍面临相对严峻的挑战。续航焦虑是其中最突出的制约因素,虽然挪威国土面积小,但对于这个三分之一国土位于寒冷北极圈的国家而言,新能源汽车在严寒气候性能表现始终无法得到让人信服的解决方案。
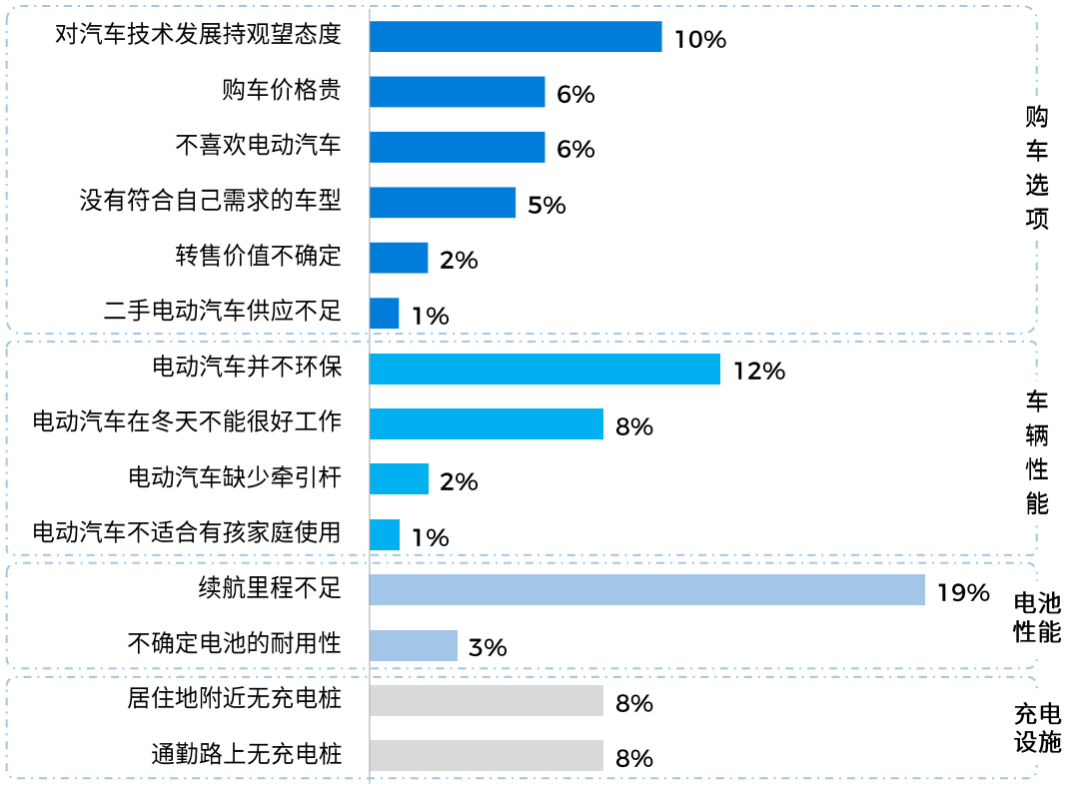
(图来源:飞书点跃《2023年绿色出行出海趋势报告》,Nordic Energy Research,Norsk Elbilforeningen, Meet Intelligence)
我们花了两期的篇幅,介绍了欧洲新能源汽车的主要特点,下一期,我们将介绍中国新能源汽车品牌,如何针对欧洲市场特点,打造他们的出海策略。
(本文内容为笔者对飞书点跃《2023年绿色出行出海趋势报告:新能源汽车和E-bike市场解读》报告的部分摘录以及笔者阅读过程中的个人观点,欢迎大家批评指正。)