每周全球金融观察 | 第 147 篇:风险资产的“天时地利”时刻
来源:岭南论坛 时间:2023-07-17
本周多方利好消息频传,风险资产的“天时地利”时刻已经到来。
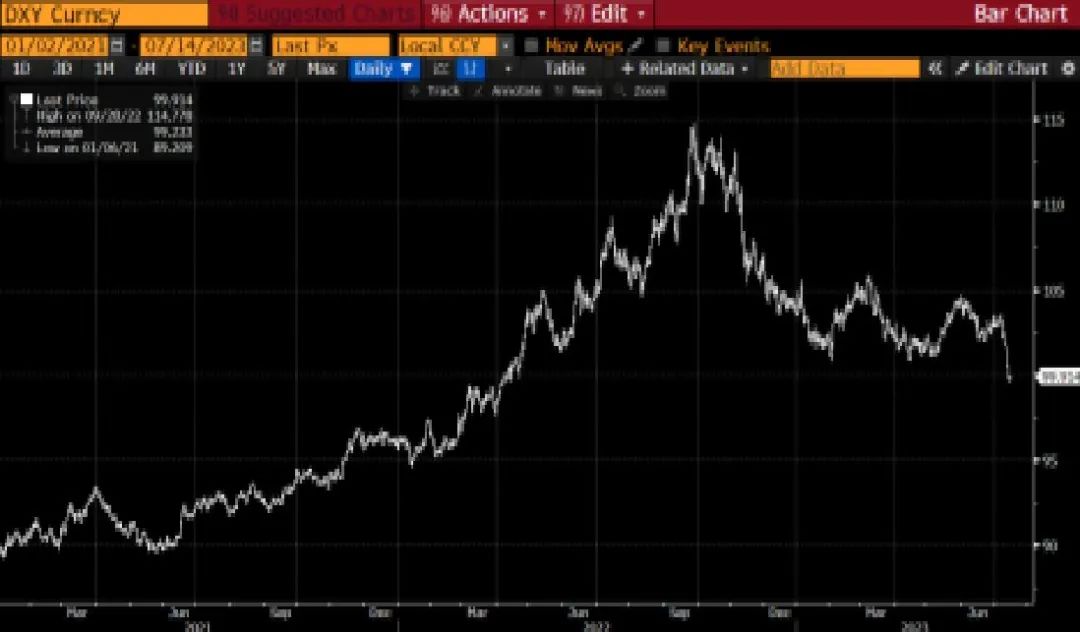
美联储最后一幕预期下,美元指数本周收盘低于 100。9 个月前,美元指数为 114.78。
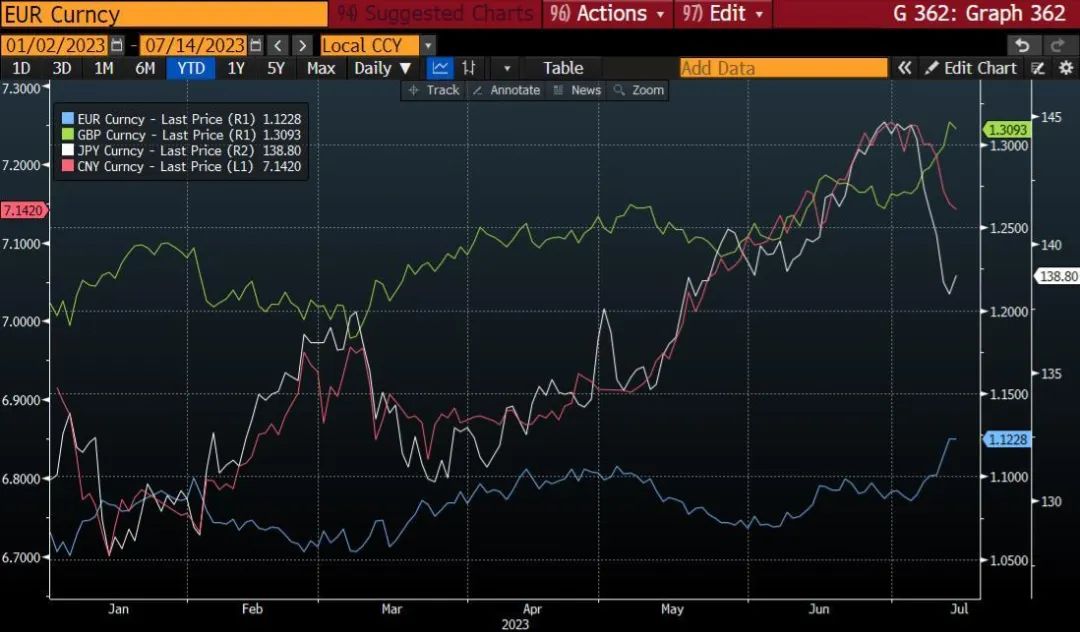
在货币政策分化成为主旋律的情况下,本周全球主要货币兑美元均出现反弹。美联储的转向也预示着新兴市场货币将迎来利好。
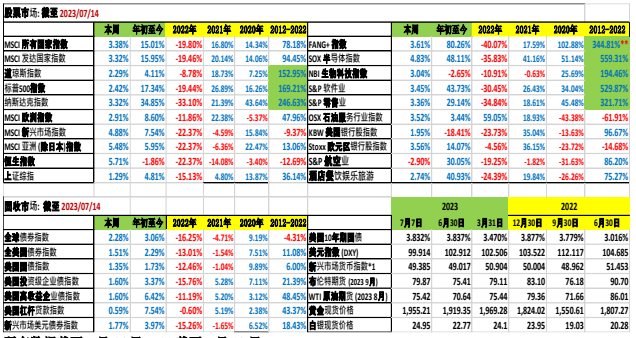
固定收益类资产本周表现出色。62.7 万亿美元(等值美元)的彭博全球综合指数上涨2.28%,这是令人垂涎的单周回报。25.4 万亿美元的美国综合指数本周上涨 1.51%,值得称道。彭博新兴市场本币指数一周收益率为 2.34%,超过美元新兴市场债券指数 1.77%的收益率。
我们将何去何从?
美国银行业:
美国 24 家银行的银行业指数(BKX 指数)在 2023 年上半年下跌了 20.47%,原因包括SVB(硅谷银行)和 First Republic 蔓延、无情加息、收益率曲线倒挂、信贷风险、经济衰退风险等等。
传统观点认为美联储加息和收益率曲线倒挂对银行不利,因为银行需要为存款支付高于贷款和投资收益的费用。但这次不是..... 硅谷银行的崩溃改变了动态,因为存款从中小银行涌向超级大银行,后者充斥着廉价存款。上周五,摩根大通、富国银行和花旗集团共同公布了第二季度 490 亿美元的净利息收入(NII)(贷款收入减去存款收入)。
摩根大通第二季度利润增长 67%,达到 144.7 亿美元(去年同期为 86.5 亿美元)。该行的净利息收入为 217.8亿美元,并将 2023年全年的净利息收入预期上调至 870 亿美元。富国银行(Wells Fargo)报告称,由于利息收入增加,第二季度利润激增 57%。花旗集团报告第二季度消费者信用卡消费增长 14%。消费衰退在哪里?
在硅谷银行和备受关注的银行业危机之后,一线银行从小型银行的存款流入中获益。净资本收入的增长速度(摩根大通、富国银行和花旗银行的年同比增长率为 30%)远高于贷款冲销(感谢抗衰退的经济)。然而,美联储数据显示,非前 100家银行的贷款冲销率远高于顶级银行。
道富银行 State Street Bank(主要是一家全球托管银行)报告称,第二季度净利息收入下降了 10%,因为该银行不得不向机构客户支付更高的利率以留住存款。
不久前,零售银行业务还被认为是一项枯燥乏味、日渐式微的业务。但现在,零售银行业务已不再是...
美联储和联邦存款保险公司在一个周末的决定避免了硅谷银行对美国银行系统的潜在灾难性影响。对于那些仍然预期美国银行系统性危机的人来说,这只是幻想。银行盈利的引擎刚刚开始轰鸣,这对经济意味着什么?
本周,从发达市场到新兴市场的所有全球股票指数均走高,而且大部分指数在年初至今均大幅走高。多头虎视眈眈。空头舔舐伤口,一些转而“冬眠蛰伏”。
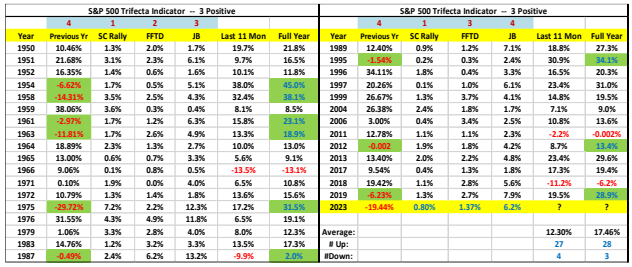
过去两个月,许多人认为市场反弹是由 5-7 只科技股引领的,不可能持续。ETF 和被动投资的特殊性以及指数化的谬误改变了动态。主动管理方面的同业排名也加剧了动态变化。 到了 6 月和 7 月,市场氛围有所扩大,标普 500 指数中超过 140 只股票创下 52 周新高,指数的所有 11 个板块在此期间均有所攀升。
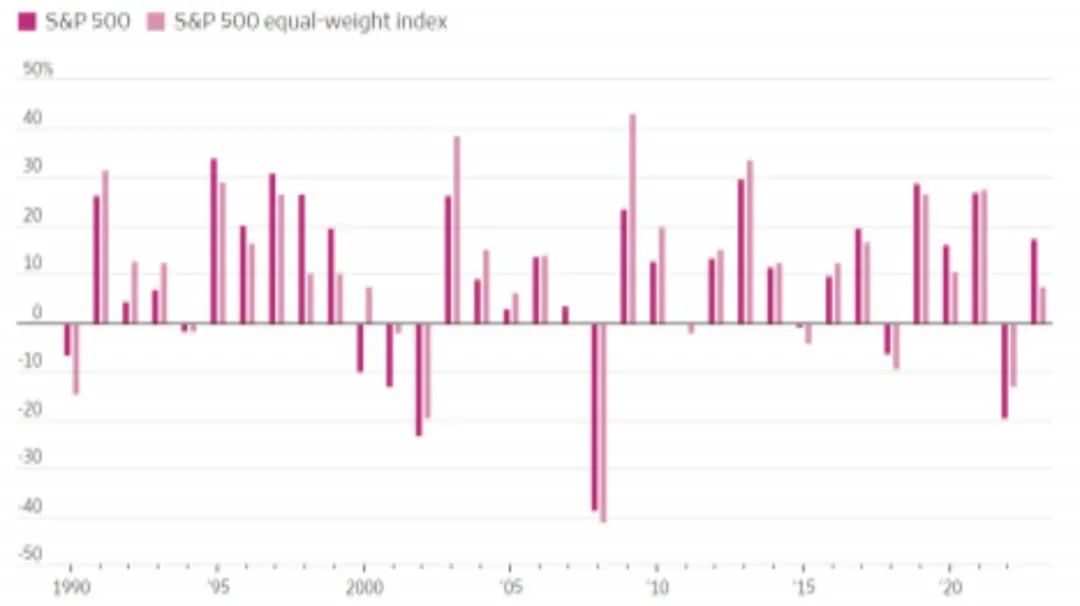
标普 500 平等权重指数正在追赶 S&P500(市值加权)指数。从历史上看,在一个较长的牛市周期中,平等权重指数的表现优于市值权重指数。
我们必须注意到,当市场行为与传统智慧不同时,我们应该停下来问一问为什么?我错过了什么吗?旧的模式在大流行后的世界是否不再适用?模式是否已经转变?
一个明显的变化是货币政策和利率传导机制。较高的利率不再对家庭和企业产生同样的影响,因此预期经济放缓。曾有两年(2020-2021 年)的世代低利率时期。锁定 3-4%的30 年期固定利率住房抵押贷款的家庭不受美联储加息的影响**。低利率的住宅抵押贷款被打包成 MBS(抵押贷款支持证券),这在银行的 "持有至到期 "投资组合中造成了未实现损失(2022 年第三季度末为 7000 亿美元), 并在今年 4 月牺牲了硅谷银行。
**想知道为什么美联储加息没有减少消费者支出?根据联邦住房金融局的数据,23%的住宅抵押贷款利率低于 3%,38%在 3-4%之间,30%在 4-6%之间,只有 9%的住宅抵押贷款利率超过 6%。目前 30 年期住宅抵押贷款利率为 7%。
在 2020 年和 2021 年锁定 5 年期、10 年期和 30 年期低利率债券的企业,其负债成本并没有随着美联储加息而增加。相反,期限风险转移到了资本市场,2022 年所有固定收益证券都出现了前所未有的亏损。我们需要考虑动态变化的因素。
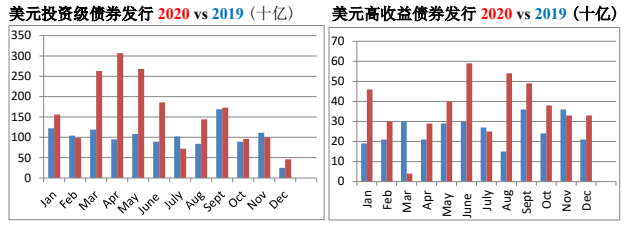
我注意到 2022 年和 2023 年信贷息差没有扩大,这有力地证明了衰退并不在地平线上。顺便说一句,倒挂的收益率曲线指标已经过时得可怜,但因其在 1980 年中期之前的先见之明而被广泛引用。

如果不考虑不断变化的动态因素,必然会得出错误的结论。
作者:蔡清福
Alvin C. Chua
2023 年 7 月 15 日, 星期六
东亚和中国股票市场的表现与全球同行的比较:

Article #147: Goldilocks Moment for Risk Assets
It was a week with good news from multiple fronts, and goldilocks ruled risk assets.
Firstly, the June US CPI was better than expected, with the headline inflation at 3.0% YoY, vs 4.0% in May and 4.9% in April. Just a year ago (June 2022) the CPI figure was 9.1%. What a differencea year has made! The core CPI was 4.8% YoY, vs 5.3% in May and 5.5% in April. Just nine months ago (Sept 2022) the core CPI was 6.6%.
The better-than-expected PPI data followed the next day, with June PPI at 2.4% YoY, vs 2.6% in May and 3.0% in April.
On Friday, the University of Michigan June consumer sentiment survey popped to 72.6 vs forecast of 65.5 and vs 64.4 reading in May. It was the highest level since Sept 2021, with a biggest one month jump since 2006.
The CME futures priced in the Fed’s last hurrah on July 26, with Fed funds rate peaking at 5.25%-5.50%. Interest rate market repriced with 2-yr UST ended the week at 4.77% vs 4.95% a week ago, and the 10-yr UST at 3.83% vs 4.07% a week ago. I must note: as much as the Fed is likely to pause after July 26, the expectation of near-term Fed rate cut must be tempered. The anticipated rate cut, like the US recession sighting, is likely to be always six months away and six months away. Higher-for-longer is a high probability scenario.
Equity market priced in the goldilocks scenario -- the Fed’s last hurrah, no imminent recession, and pleasant surprises from Q2 earnings reported this week. The Nasdaq 100, Nasdaq composite, S&P 500, and Dow gained 3.52%, 3.32%, 2.42%, and 2.29% respectively this week. YTD, the Nasdaq 100, Nasdaq composite, S&P500 and Dow gained 42.28%, 34.85%, 17.34%, and 4.11% respectively. However, the bigger gainers this week have been the EM equities, with MSCI EM, MSCI Asia ex-Japan, and MSCI China gaining 4.88%, 5.48%, and 5.96% respectively.
The dollar index priced in the Fed’s last hurrah, ended the week below 100. Nine months ago, the dollar index was at 114.78.
With monetary policy divergence being the main theme, all the major global currencies rallied against the dollar this week. The Fed pivot also bodes well for the EM currencies.
Fixed income asset classes are having a great week. The 62.7 trillion (USD equivalent) Bloomberg Global Aggregate index gaining 2.28% is a salivating one-week return. The US$25.4 trillion US Aggregate index with 1.51% gain this week is notable to write home about. The Bloomberg EM local currency index with 2.34% one-week return outperforms the USD EM bond index with 1.77% return.
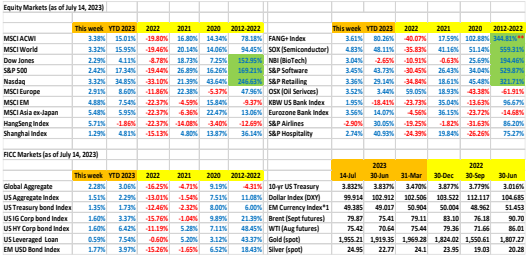
The 24-bank US banking index (BKX index) lost 20.47% in the first half of 2023, on fears ranging from SVB and First Republic contagion, relentless rate hikes, inverted yield curve, credit risk, recession risk, and the list goes on…
The conventional thinking has been: Fed raising interest rates and an inverted yield curve is detrimental to the banks, as banks need to pay more for deposits than what they earn from loans and investments. Not this time … the debacle of SVB (Silicon Valley Bank) changed the dynamics, as deposits flocked from small and medium sized banks to the super-large banks, who are flooded with cheap deposits. On Friday, JP Morgan, Wells Fargo, and Citigroup collectively reported US$49 billion net interest income (NII) in Q2 (what they earned from loans minus what they paid on deposits).
JP Morgan reported profits surged 67% in Q2 to US$ 14.47 billion (up from $8.65 billion a year ago). The bank made $21.78 billion in net-interest, and raised its NII forecast for the full year 2023 to $87 billion. Wells Fargo reported 57% surge in Q2 profit due to higher interest income.Citigroup reported consumer credit card spending was up 14% in Q2. Where is the consumer recession?
Post SVB and the much-touted banking crisis, the top tier banks benefited from the influx of deposits from the smaller banks. NII was growing much faster (30% YoY for JPM, Wells, and Citi) than loan charge offs (thanks to the recession proof economy). However, Fed data shows the charge-offs from the non-top 100 banks are at much higher rate than the top tier banks.
State Street (primarily a global custodian bank) reported a 10% NII decline in Q2, as the bank was having to pay higher interest rates to institutional customers to retain deposits.
Not that long ago, retail banking was considered a boring and diminishing business. No more …
The SVB potentially disastrous impact on US banking system was averted by the Fed and FDIC decision over a weekend. For those who still anticipate a US banking systemic crisis are delusional. Bank earnings just started with turbo-charger. What does it mean for the economy?
Every global equity index, from developed markets to EMs were higher this week, and most weremeaningfully higher YTD. The bulls are starring at us. The bears are licking their wounds. Some went into hibernation.
At the end of January, I posted the Trifecta Indicator, and made the comment that the S&P500 has a 90% probability (100% with a 4th dimension) being higher in 2023. There were MANY skeptics and quite a bit of laughers. YTD July 14, the S&P500 has gained 17.34%.
Last two months, many have argued that the market rally was led by 5-7 tech stocks and could not be sustainable. The idiosyncrasies of ETFs and passive investing as well as the fallacies of indexing changed the dynamics. Peer group ranking in active management added to the shifting dynamics. By June and into July, the market breadth has expanded with more than 140 stocks in the index have hit fresh 52-week highs and all 11 sectors of the S&P 500 have climbed during that period.
The S&P500 equal weighted index is catching up with the S&P500 (market cap weighted). Historically, the equal weighted has outperformed the market weight in an extended bull market cycle.

We must note, when market behaves differently from conventional wisdom, we should pauseand ask why. Am I missing something? Are the old models no longer applicable in the post-pandemic world? Had the paradigm shifted?
An obvious shift is the monetary policy and interest rate transmission mechanism. Higher rates no longer have the same effect on households and corporates and therefore the anticipated slowdown in the economy. There was a two-year period (2020-2021) of generational low interest rates. Households locked in 3-4% 30-year fixed rate home mortgages are immune from the Fed rate hikes**. The low interest rate residential mortgages were packaged into MBS (Mortgage-backed securities) which blew a hole in unrealized losses in the “hold-to-maturity” investment portfolio at banks (US$700 billion at the end of Q3 2022). and claimed the sacrificial lamb Silicon Valley Bank in April.
** Wonder why the Fed rate hikes have not diminished consumer spending? According to data from Federal Housing Finance Agency, 23% of residential mortgages have interest rate less than 3%, 38% are between 3-4%, 30% are between 4-6%, and only 9% of residential mortgages has over 6% interest rate. The current 30-yr residential mortgage interest rate is 7%.
Corporates that locked in low interest rate 5-yr, 10-yr and 30-yr bonds in 2020 and 2021, their liability cost did not increase with Fed rates hikes. Instead, the duration risks were transferred to the capital markets, with unprecedented losses across all fixed income securities in 2022. We need to factor in the shifting dynamics.
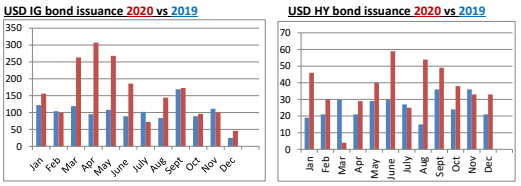
I noted the lack of credit spread widening in 2022 and 2023 being a strong evidence that recession is NOT in the horizon. Btw, the inverted yield curve gauge is pathetically outdated but widely quoted for its pre-mid 1980 prescience.

Failure to factor in the changing dynamics WILL invariably lead to erroneous conclusions.


